Background | Enter Data | Analyze Data | Interpret Data | Report Data
Analyze
Click “Analyze,” “Descriptive Statistics,” and then “Descriptives.”

Descriptives box
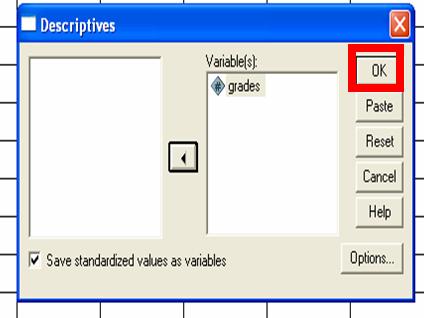
This box will appear. There will be two big windows in this box, one on the right and one on the left. You should see your variable name in the box on the left. Your goal will be to move your variable name to the Variables box on the right. To do this, click on your variable name to highlight it. Next, click the arrow button.

Your variable name should move to the box on the right. The next step will be for you to check the box labeled “Save standardized values as variables.” To put a check in this box, simply click the box with your mouse.

Click OK
When you are finished, click the OK button and wait a few seconds for processing.
You will see some descriptive statistics for your data set like the number of scores (N), minimum and maximum score, the mean and the Standard Deviation. This file will NOT contain your Z-scores. However, you may want to remember the mean so write it down if that’s the case.

So where are the Z-scores
It’s interesting. The Z-scores do not appear in the output file. They actually appear instead in the data file that you had created earlier. This data file should still be open. Click this data file to view it.
In your data file
You will see two columns in your data file. The first column is the one that you created. It contains the name that you gave it and the scores that you entered. In our example, the first column is still “grades” and still contains all of the exam grades from students in the class. The second column is new. It is something that was generated by SPSS when we conducted our analysis. The second column contains Z-scores. SPSS will name the second column for you. It will give the second column the same name as the first column with a letter ‘z’ in front of it. In our example, the second column is named ‘zgrades’ to tell you that it contains all of the Z-scores for the grades column.

Save the Data file again
You data file has changed since you conducted this analysis. So, it’s a good idea to save this file again. Click ‘File’ and then ‘Save.’ If you do this, your file will be saved under the same name that you chose originally.
Background | Enter Data | Analyze Data | Interpret Data | Report Data