Background | Enter Data | Analyze Data | Interpret Data | Report Data
Look in your data file
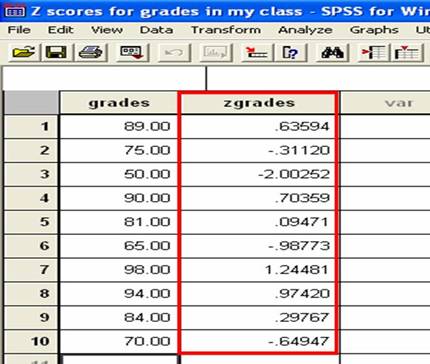
The data that you typed in will appear in the left most column. Your z-scores will appear in a second column of data with the letter ‘z’ in front of its name. In our example, the second column is named ‘zgrades’ to tell you that it contains all of the Z-scores for the grades column.
Identifying Z-Scores
Each data point that you entered in the column on the left will have a corresponding z-score printed in the column just next to it. In our example, the first score that we entered was a grade of 89. You can see this score at the top of the left most column. The z-score for this raw score of 89 is 0.64 (when rounded). You can see the 0.63594 at the top of the second column. So each z-score will be printed right next to each raw score.
Positive and Negative Z-Scores
Some z-scores will be positive whereas others will be negative. If a z-score is positive, its’ corresponding raw score is above (greater than) the mean. If a z-score is negative, its’ corresponding raw score is below (less than) the mean.
If a Z-Score has a Positive Value…
This means that it is above the group mean. See all of the positive z-scores in our example? For example, look at the top most z-score, 0.64. It is positive because it does not have a negative sign in front of it. This z-score corresponds with the exam score of 89%. Because the z-score is positive, we can conclude that the exam score of 89% is above the group mean. This means that the person who scored a 89% performed better than average.
If a Z-Score has a Negative Value…
This means that it is below the group mean. See the three negative z-scores in our example? They are the ones with the negative sign in front of them. For example, look at the bottom most z-score, -0.65. This z-score corresponds with the exaam score of 70%. Because the z-score is negative, we can conclude that the exam score of 70% is below the group mean. This means that the person who scored a 70% performed less than average.
Z-Scores and Standard Deviation
The absolute value of the z-score tells you how many standard deviations you are away from the mean. If a z-score is equal to 0, it is on the mean. If a Z-Score is equal to +1, it is 1 Standard Deviation above the mean. If a z-score is equal to +2, it is 2 Standard Deviations above the mean. If a z-score is equal to -1, it is 1 Standard Deviation below the mean. If a z-score is equal to -2, it is 2 Standard Deviations below the mean. In our example, your score was 98%. This raw score had a corresponding z-score of +1.24. The value of this z-score tells us that your raw score of 98% was 1.24 standard deviations away from the mean. Further, if we consider the positive sign, we can see that your raw score is 1.24 standard deviations above the group mean. This means that raw score of 98% is pretty darn good relative to the rest of the students in your class.
Z between -2 and +2
95% of scores are going to be no more
than 2 standard deviation units away from the mean. That means that most scores
will fall between z=-2 to z=+2. However, some scores will be greater than the
absolute value of 2. You can interpret these scores to be very far from the
mean.
Background | Enter Data | Analyze Data | Interpret Data | Report Data