Four things to report
You will want to include four main things about your Pearson’s r when communicating results to others.
1. Test type and use
You want to tell your reader what type of analysis you conducted. You also want to tell your reader why this particular analysis was used. What did your analysis tests for? Example
You can report data from your own experiments by using the template below.
A ________________________________________ was computed to assess the
relationship between (Variable 1) _____________________ and (Variable 2)
____________________.”
Some people refer to Pearson’s r as a “Pearson product-moment correlation coefficient” so that’s how I’ll refer to it here. If we were reporting data for our example, we might write a sentence like this.
“A Pearson product-moment correlation coefficient was computed to assess the relationship between the amount of water that one consumed and rating of skin elasticity.”
2. Pearson’s r value and (possibly) significance values.
You want to tell your reader the value of Pearson’s r so that they can understand the strength of the relationship between variables. You also might want to tell your reader whether or not there was a significant difference between condition means. Recall that some people believe you should report significance when you conduct a Pearson’s r, but other people don’t feel the same way. I am going to tell you how to report significance so that we have all our bases covered. You can report data from your own experiments by using the template below.
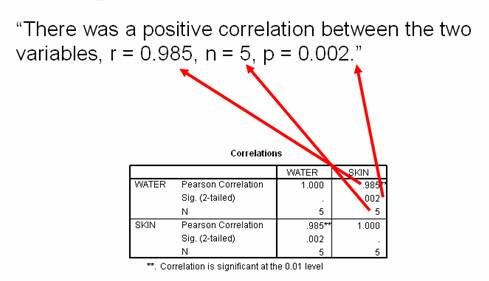
“There was a correlation (no correlation) between the two variables [r = _______, n =_______, p = ________].”
Just fill in the blanks by using the SPSS output
Once the blanks are full…
You have a sentence that looks very scientific but was actually very simple to produce.
“There was a positive correlation between the two variables, r = 0.985, n = 5, p = 0.002.”
3. Reference to your scatterplot
You might want to make reference to the scatterplot that you created. The you’ll most likely want to put your scatterplot, and all other graphs, in the Figures section of your APA style paper. The problem is that no one will know they are in that section unless you make reference to them in the text. You can use the following template to reference your scatterplot.
“A scatterplot summarizes the results (Figure ____)”
In the blank in the above sentence, you will put the Figure number. If your scatterplot is the only figure that you are referencing, you can use a 1. Otherwise, use the number that your scatterplot corresponds with. In our example, we will assume that our scatterplot is the only figure in the Figures section. For this reason, we would write the following sentence.
“A scatterplot summarizes the results (Figure 1)”
You’ll want to briefly recap in words that people can understand. Try to imagine trying to explain your results to someone who is not familiar with science. In one sentence, explain your results in easy to understand language. Example
You might write something like this for our example.
“Overall, there was a strong, positive correlation between water consumption and skin elasticity. Increases in water consumption were correlated with increases in rating of skin elasticity.” Let’s see how this looks all together
When you put the three main components together, results look something like this.
“A Pearson product-moment correlation coefficient was computed to assess the relationship between the amount of water that one consumed and rating of skin elasticity. There was a positive correlation between the two variables, r = 0.985, n = 5, p = 0.002. A scatterplot summarizes the results (Figure 1) Overall, there was a strong, positive correlation between water consumption and skin elasticity. Increases in water consumption were correlated with increases in rating of skin elasticity.”
Looking great!
Background | Enter Data | Analyze Data | Interpret Data | Report Data
|