Three or four things to report
You will be reporting three or four things, depending on whether you find a significant result for your 1-Way Within Subjects ANOVA
1. Test type and use
You want to tell your reader what type of analysis you conducted. This will help your reader make sense of your results. You also want to tell your reader why this particular analysis was used. What did your analysis tests for? Example
You can report data from your own experiments by using the template below.
“A one-way within subjects (or repeated measures) ANOVA was conducted to compare the effect of (IV)______________ on (DV)_______________ in _________________, __________________, and __________________ conditions.”
If we were reporting data for our example, we might write a sentence like this.
“A one-way within subjects (or repeated measures) ANOVA was conducted to compare the effect of beverage type on number of hours slept in caffeine, juice and beer conditions.”
2. Significant differences between conditions
You want to tell your reader whether or not there was a significant difference between condition means. You can report data from your own experiments by using the template below.
“There was a significant (not a significant) effect of the IV ___________, Wilks’ Lambda
= ____, F (____,____) = _____, p = _____.
Just fill in the blanks by using the SPSS output
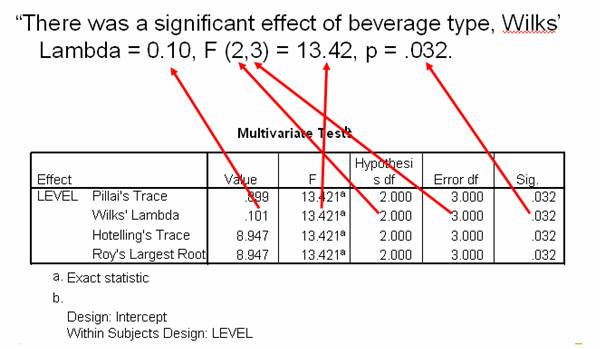
Let’s fill in the values. You are reporting the Wilk’s Lamda value, the degrees of freedome (df), the F value (F) and the Sig. value (often referred to as the p value).
Once the blanks are full…
You have a sentence that looks very scientific but was actually very simple to produce.
“There was a significant effect of beverage type, Wilks’ Lambda = 0.10, F (2,3) = 13.42, p = .032.”
3. Only if result of test was significant, report results of post hoc tests
In the previous chapter on interpretation, you learned that the significance value generated in a 1-Way Within Subjects ANOVA doesn’t tell you everything. If you find a significant effect using this type of test, you can conclude that there is a significant difference between some of the conditions in your experiment. However, you will not know where this effect exists. The significant difference could be between any or all of the conditions in your experiment. In the previous chapter, you learned that to determine where significance exists you need to conduct a series of paired samples t-tests to compare each condition with all other conditions. If you have an IV with 3 levels, like the one in this example, you would need to conduct and report the results of three additional paired samples t-tests. Remember that you are using the number 0.017 to determine statistical significance, rather than .05, because you are doing three tests instead of just one (05/3 = 0.017).
Example
Because we have found a statistically significant result in this example, we needed to compute three additional paired samples t-tests. We used one Paired Samples T-Test to compare just the caffeine and juice conditions. A second Paired Samples T-Test to compare just the caffeine and beer conditions. And a third Paired Samples T-Test to compare just the juice and beer conditions. The results of these three tests must be reported. In the paired samples t-test chapter, you learned how to report the results of such tests. Here’s what the results of our three Paired Samples T-tests might look like.
“Three paired samples t-tests were used to make post hoc comparisons between conditions. A first paired samples t-test indicated that there was a significant difference in the scores for caffeine (M=5.4, SD=1.14) and beer (M=9.4, SD=1.14) conditions; t(4)=-5.66, p = .005. A second paired samples t-test indicated that there was a significant difference in the scores for caffeine (M=5.4, SD=1.14) and juice (M=7.2, SD=1.10) conditions; t(4)=-4.881, p = .009. A third paired samples t-test indicated that there was no significant difference in the scores for juice (M=7.2, SD=1.10) and beer (M=9.4, SD=1.14) conditions; t(4)=-3.773, p = .02.”
4. Report your results in words that people can understand
Since it might be hard for someone to figure out what that sentence means or how it relates to your experiment, you want to briefly recap in words that people can understand. Try to imagine trying to explain your results to someone who is not familiar with science. In one sentence, explain your results in easy to understand language. Example
You might write something like this for our example.
“These results suggest that beverage type really does have an effect on hours of sleep. Specifically, our results suggest that when humans drink caffeine, they sleep significantly less than when they drink juice and when they drink beer. However, there is no real difference in hours slept when comparing juice and beer consumption.”
This sentence is so much easier to understand than the scientific one with all of the numbers in it. Let’s see how this looks all together
When you put the three main components together, results look something like this.
“A one-way within subjects (or repeated measures) ANOVA was conducted to compare the effect of beverage type on number of hours slept in caffeine, juice and beer conditions. There was a significant effect of beverage type, Wilks’ Lambda = 0.10, F (2,3) = 13.42, p = .032. Three paired samples t-tests were used to make post hoc comparisons between conditions. A first paired samples t-test indicated that there was a significant difference in the scores for caffeine (M=5.4, SD=1.14) and beer (M=9.4, SD=1.14) conditions; t(4)=-5.66, p = .005. A second paired samples t-test indicated that there was a significant difference in the scores for caffeine (M=5.4, SD=1.14) and juice (M=7.2, SD=1.10) conditions; t (4)=-4.881, p = .009. A third paired samples t-test indicated that there was no significant difference in the scores for juice (M=7.2, SD=1.10) and beer (M=9.4, SD=1.14) conditions; t (4)=-3.773, p = .02.. These results suggest that beverage type really does have an effect on hours of sleep. Specifically, our results suggest that when humans drink caffeine, they sleep significantly less than when they drink juice and when they drink beer. However, there is no real difference in hours slept when comparing juice and beer consumption.”
Looks pretty complicated but it is simple when you know how to write each part. Background | Enter Data | Analyze Data | Interpret Data | Report Data
|