Background |
Enter Data |
Analyze Data |
Interpret Data |
Report Data
Background |
Enter Data |
Analyze Data |
Interpret Data |
Report Data
Three things to report
You will want to include three main things about the Paired Samples T-Test when communicating results to others.
1. Test type and use
You want to tell your reader what type of analysis you conducted. If you don’t, your results won’t make much sense to the reader. You also want to tell your reader why this particular analysis was used. What did your analysis tests for? Example
You can report data from your own experiments by using the template below.
“A paired-samples t-test was conducted to compare (your DV measure) _________ in (IV level / condition 1) ________and (IV level / condition 2)________ conditions.”
If we were reporting data for our example, we might write a sentence like this.
“A paired-samples t-test was conducted to compare the number of hours of sleep in caffeine and no caffeine conditions.”
2. Significant differences between conditions
You want to tell your reader whether or not there was a significant difference between condition means. You can report data from your own experiments by using the template below.
“There was a significant (not a significant) difference in the scores for IV level 1 (M=___, SD=___) and IV level 2 (M=___, SD=___) conditions; t(__)=___, p = ____”
Just fill in the blanks by using the SPSS output
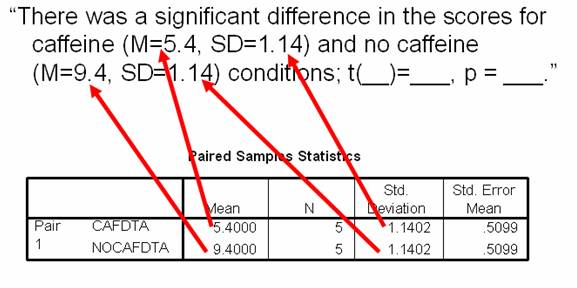
Let’s start by filing in the Mean and Standard Deviation for each condition.
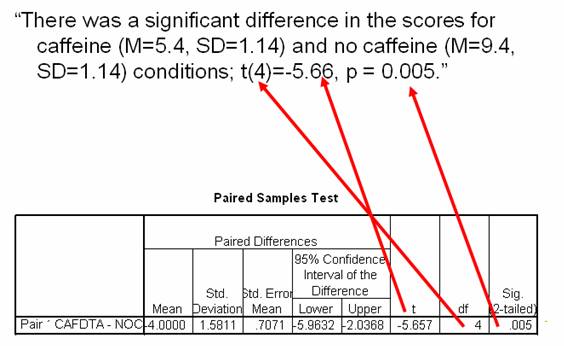
Now we’ll finish up by filling in the values related to the paired T-Test. Here we enter the degrees of freedom (df), the t-value (t), and the Sig. (2-tailed) value (often referred to as the p value).
Once the blanks are full…
You have a sentence that looks very scientific but was actually very simple to produce.
“There was a significant difference in the scores for caffeine (M=5.4, SD=1.14) and no caffeine (M=9.4, SD=1.14) conditions; t(4)=-5.66, p = 0.005.”
Since it might be hard for someone to figure out what that sentence means or how it relates to your experiment, you want to briefly recap in words that people can understand. Try to imagine trying to explain your results to someone who is not familiar with science. In one sentence, explain your results in easy to understand language. Example
You might write something like this for our example.
“These results suggest that caffeine really does have an effect hours slept. Specifically, our results suggest that when humans consume caffeine, the number of hours they sleep decreases”
You could have also written the following sentence.
“These results suggest that caffeine really does have an effect hours slept. Specifically, our results suggest that when humans consume less caffeine, the number of hours they sleep increases.”
Both sentences are so much easier to understand than the scientific one will all of the numbers in it. Let’s see how this looks all together
When you put the three main components together, results look something like this.
“A paired-samples t-test was conducted to compare hours of sleep in caffeine and no caffeine conditions. There was a significant difference in the scores for caffeine (M=5.4, SD=1.14) and no caffeine (M=9.4, SD=1.14) conditions; t(4)=-5.66, p = 0.005. These results suggest that caffeine really does have an hours slept. Specifically, our results suggest that when humans consume caffeine, the number of hours they sleep decreases.”
Looking good!
Background | Enter Data | Analyze Data | Interpret Data | Report Data
|